
Let’s talk about MIOsoft’s newest venture, Barrage.
Barrage provides insightful real-time analytics and alerting for IoT data. You can also use Barrage to store data for historical examination and analysis—and do real-time analytics at the same time.
At first glance, Barrage might seem like a left turn for us. But it’s not, really. It all ties back to our R&D mindset: we see a problem, and we have a burning need to figure out how to solve it. Sometimes the solution is context. And sometimes it’s Barrage.
The problem
We’ve been following the development of the IoT market with great interest. One of the things that we noticed was that real-time IoT monitoring—while a cool idea—seemed to be stuck at detecting thresholds.
We don’t have a problem with thresholds per se. We just don’t think you can go very far with them.
Threshold alerting depends on the idea that you already know of a value which is likely to be associated with interesting events. You set this known value as the threshold value. You can then get alerts for three things:
So, great. You can get a real-time alert when a sensor’s reporting that it’s loud. Or it’s cold. Or it’s dark.
This is some pretty basic information, even with the actual value attached, because you don’t know why it’s loud, cold, or dark.
Presumably you set up your real-time threshold alerts because you associate the threshold values with events that you want to know about or respond to quickly. But the threshold alert doesn’t give you enough information to figure out a reasonable response. Is the event something you can address, or do you need to call someone else? Is it an event you just need to be aware of, or does it need a response soon? Or is it a serious crisis that needs an immediate response?
You can, of course, use threshold alerts to trigger further analysis that can get you these details. But if you do that, you’re not working with real-time alerts anymore. You have to wait for the analysis to complete before you get more insight into what your sensors are telling you.
So threshold alerts basically leave you with two options: real-time alerts with little information, or delayed alerts with more information.
The solution
So think about the data that you get from a sensor.
A sensor records data about one or more characteristics of its environment. These characteristics can be virtually anything: temperature, sound level, light level, geolocation, motion, and on and on.
The key to sensors—at least, the key to sensors that are working correctly—is that, while a sensor may record many pieces of the data at the same time, there will only be one value at a time for each characteristic the sensor monitors. A sensor that’s reading air temperature, for instance, will not report that the air temperature is simultaneously 72.4 and 76.0.
So we’re confident that when Barrage receives sensor data, if it’s arranged by time, only one value per time per characteristic will exist. This is why Barrage automatically uses the time-series approach for all data.
Once the sensor data for a characteristic is arranged by time, it can be visualized on a standard X-Y graph, with time as the x-axis.
Now consider these different sound events, from Quietyme, all from a time vs decibel level graph.

![]()
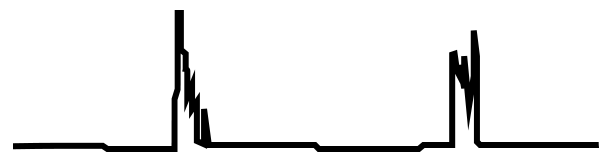
The ultimate goal of Quietyme’s customer hospitals is a quiet sleep environment for patients. So they want real-time alerts about ongoing disturbances that nurses and hospital staff can stop, like loud conversations and alarms.
Quietyme’s customers don’t want real-time alerts about disturbances that are outside of their staff’s control, or about one-time events that are self-resolving. Nurses can’t do anything about the weather, so alerts for thunder are just a distraction. If someone drops a tray or slams a door, there’s no solution; a nurse coming in will just disturb the patient a second time.
But as you can see from Quietyme’s examples, different sound events are, well… different. Events are characterized by what we call their patterns.
We saw that patterns could deliver what thresholds can’t, and we launched a skunkworks project to create a tool that could bring patterns to the IoT (affordably). Barrage is the result.
vBy matching on patterns instead of thresholds, Barrage can identify the actual event that has occurred in real time, as soon as it happens. Patterns can be tied to alerts so that not only do real-time alerts only go out for events of interest, but alerts for specific patterns go to specific recipients. An alert recipient can always know what they’re getting an alert for.Patterns
Pattern matching is the answer when thresholds fall short. But what exactly are patterns?
From the data’s perspective, the pattern is distinctive characteristics of an event: for each value in the event, how does the value’s magnitude compare to the magnitude of previous and subsequent values? What is the rate of value change during the event? How long does the event last? Do values or series of values repeat?
This perspective of patterns is analogous to how we would conversationally describe a sensor event to another person: a sudden 10dB rise that lasts two seconds then returns to the baseline, repeated four times, or a steady rise of between 2 and 5 degrees F per second for at least two minutes.
So a pattern is a description of the relationships between a series of sensor values. Inside Barrage, a pattern is defined as a sequence of conditions. A pattern is matched only when all of its conditions are met, in order, for a particular series of sensor values.
Consider this pattern:
A sudden 10dB rise from the baseline that lasts two seconds then returns to the baseline, repeated four times.
For this example, let’s say that the sensor records one value per second.
The core of the pattern is a sudden 10dB rise from the baseline that lasts two seconds then returns to the baseline. You can describe this pattern as a series of conditions in a fairly straightforward way:
Barrage can understand this series of conditions as a subpattern. The pattern itself would then be simple:
And that’s it. If data comes in so that all the conditions in the subpattern are met four times in a row, the pattern’s condition is met, and the pattern has been found. If any condition in the subpattern isn’t met during those four repetitions, the pattern’s condition isn’t met, and there’s no match.
Of course, this is an extremely simple pattern. It does show how Barrage pattern conditions can reference a sensor’s current and previous values. But pattern conditions can also reference the values of other sensors, as well as things like arithmetic and statistics.
Matching
In real data, there are three especially important factors we have to keep in mind during matching:
If your sensor is monitoring both temperature and sound, temperature patterns aren’t relevant to sound values, and vice versa. But for values that a pattern is relevant to, any value could be the start of a pattern.
Barrage accounts for all of these factors. A pattern’s definition includes the sensors that it should search, as well as the types of values that it’s applicable to. And Barrage treats every sensor value that arrives as a possible start value of a pattern, even if pattern matching initiated on a previous value is still in progress.
Because of this, Barrage pattern searches constantly overlap; it’d be virtually impossible to do real-time alerts if they didn’t. Each pattern search operates independently of the others.
When a pattern match is found, it's found as soon as the last condition of the pattern is met. So the alert can go out immediately, in real time, even if other pattern-matching is still going on. This is how Barrage gives you the best of both worlds in your alerts: they're in real time, and they have more information than a threshold match can provide.
Inside Barrage
So here’s an inside exclusive-to-the-blog look at Barrage, under-construction UI and all.
In Barrage, the first thing you do is choose an event stream. The event stream is a group of sensors that you want to analyze together: if your sensors are located in buildings, for example, each building might have its own event stream. If your sensors are located in vehicles, an event stream might exist for each fleet.
Once you’ve selected an event stream, you can examine its data, define its patterns, and configure its notifications.
Administrative tasks for the event stream can be performed on the Configure page. From this page, you can view the sensors that are available in the event stream, manage the event stream’s database, and upload new sensors, among other things.
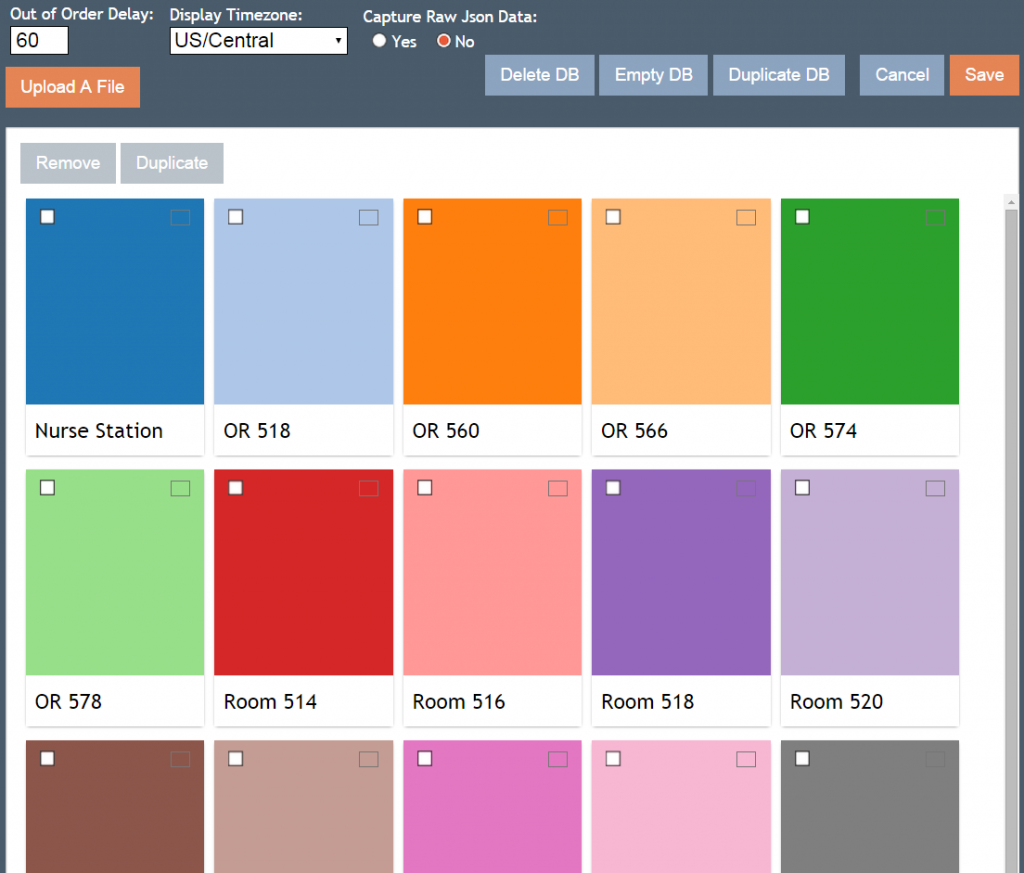
Each sensor has a “paint chip” associated with its entry on this page, which indicates the sensor’s assigned color on the Visualize page.
The Visualize page lets you view any of the data in your event stream.
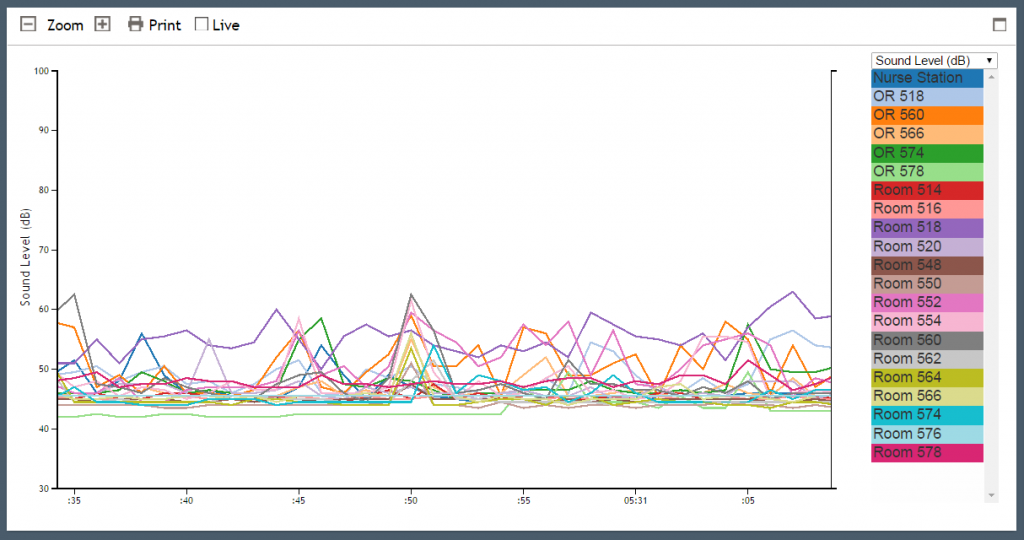
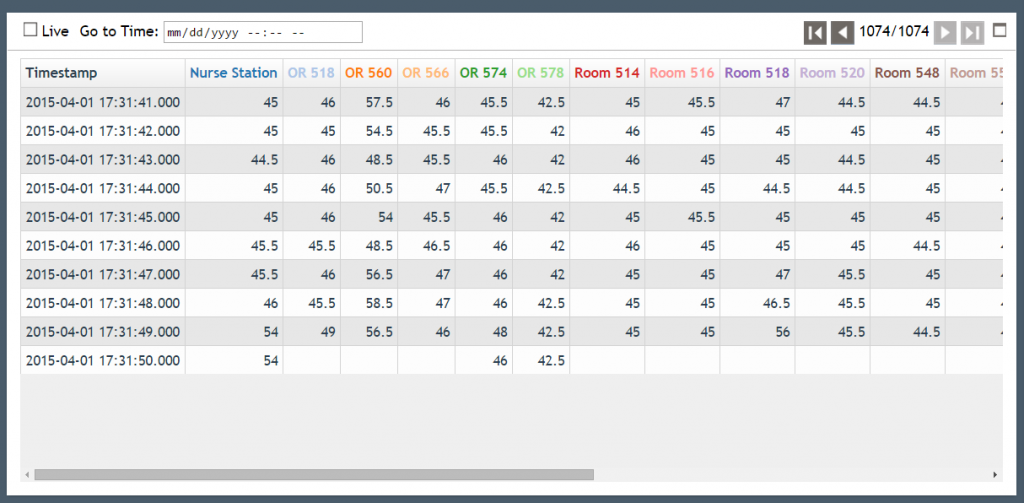
Initially, both the visualization and the tabular data will appear in the page, but you can expand either one to fill the entire thing. The visualization and the tabular data can be adjusted independently.
In the visualization, use the menus on the right to select the y-axis you want to use and the sensors that you want to view data from. The display automatically updates as you select. You can use the zoom function to adjust the x-axis, and choose whether to view live data.
The tabular data allows you to view the sensor data in numerical format. The timestamp column on the left-hand side shows when the sensor data is from. Each sensor’s column header is color-coded to correspond to its visualization color. You can navigate through the tabular data by page, view live data, or jump to data at a specific timestamp.
The Patterns page is where you define your patterns.
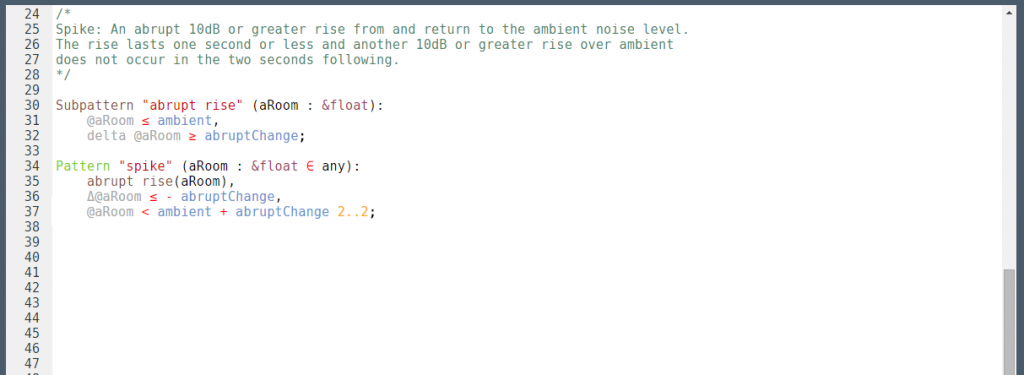
The page automatically color-codes the text you enter and uses clear line numbering to help you keep track of your pattern definitions. Auto-completion pop-ups help you complete text or add a definition template to the page.
Finally, you can assemble your real-time alerts on the Notify page.
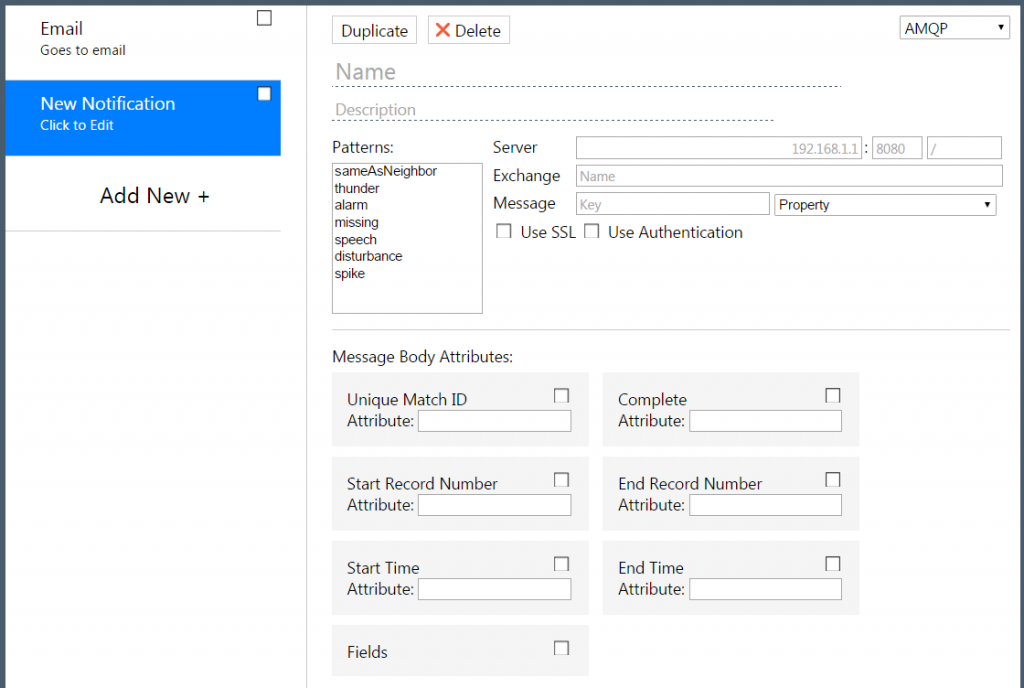
You can configure as many alerts as your event stream needs, and send them via methods like email, AMQP (RabbitMQ), and web hooks.
What’s next
This week the Barrage team is at O’Reilly Solid, immersing themselves in the IoT world. Say hi if you see someone from Team Barrage out and about at the conference, or stop by and visit Barrage at booth P17 on Wednesday and Thursday.
Currently, we’re looking for candidates to be Barrage early adopters. If you’re accepted into the early adopter program, you can get Barrage before anyone else at a reduced cost, and we’ll use your feedback to refine the Barrage user experience before the public release.
When Barrage is released to the public, you’ll be able to sign up for an account at databarrage.com and begin using Barrage immediately.

 For Data Migration