
The Yahara watershed is home to 370,000 people and 30,000 cows. It covers 170,000 acres and has 5 major lakes, linked by the Yahara River, and formed 14,000 years ago as the glaciers retreated.
Reports from early European settlers praised the clarity of the lakes and their beautiful white sand. And cradled among the three northernmost lakes—Mendota, Monona, and Wingra—was the infant city of Madison.
You can probably guess what happened next.
Mendota, the largest lake, was dammed in 1849, raising its water levels about five feet. By 1890, most of Madison’s sewage was pouring, untreated, into Monona, a practice that didn’t entirely end until 1936. Mendota was the clean one, comparatively, at least until increases in commercial fertilizer use and urban development post-WWII ran up its pollution levels, too.
Lakes Waubesa and Kegonsa lie farther south of the city, but they didn’t escape its effects. Raw sewage was dumped into Waubesa as late as 1958. And whatever goes into the four northernmost lakes flows downstream into Kegonsa, through the Yahara River.
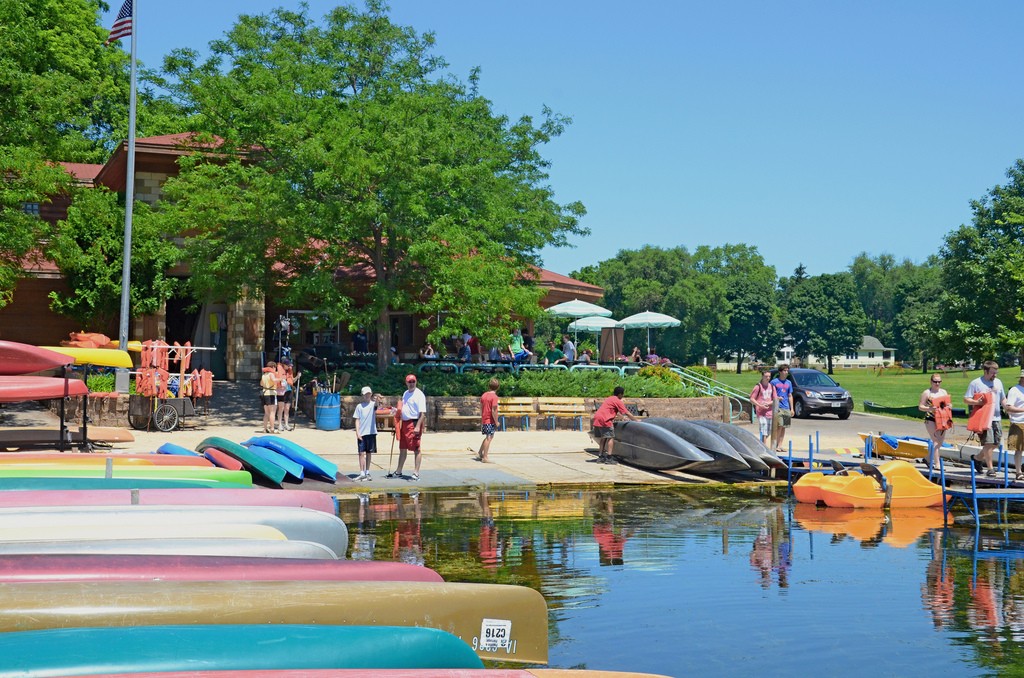
Today, the lakes are still beautiful.
"Aerial View of Campus..." by Jeff Miller/UW Madison | CC By 2.0
But their clarity is nothing to write home about. The beaches are—at best—beige.
The goal of Clean Lakes Alliance (CLA) is to improve and protect the water quality of the Yahara watershed. It’s not a simple task: besides Madison and its satellite communities, the watershed also contains a lot of very productive farmland, not to mention all those dairy cows. Rural and urban areas each bring their own set of water quality challenges.
Addressing those challenges often means advocating for increased public spending, which is often decided at the polls. CLA’s mission needs public support, which means it needs public awareness.
Luckily, it’s the internet age, so making information about water quality widely available in near-real-time is possible. In early 2014, CLA and MIOsoft partnered to create a MIOedge-hosted web application, LakeForecast.org, which is making its public debut this summer.
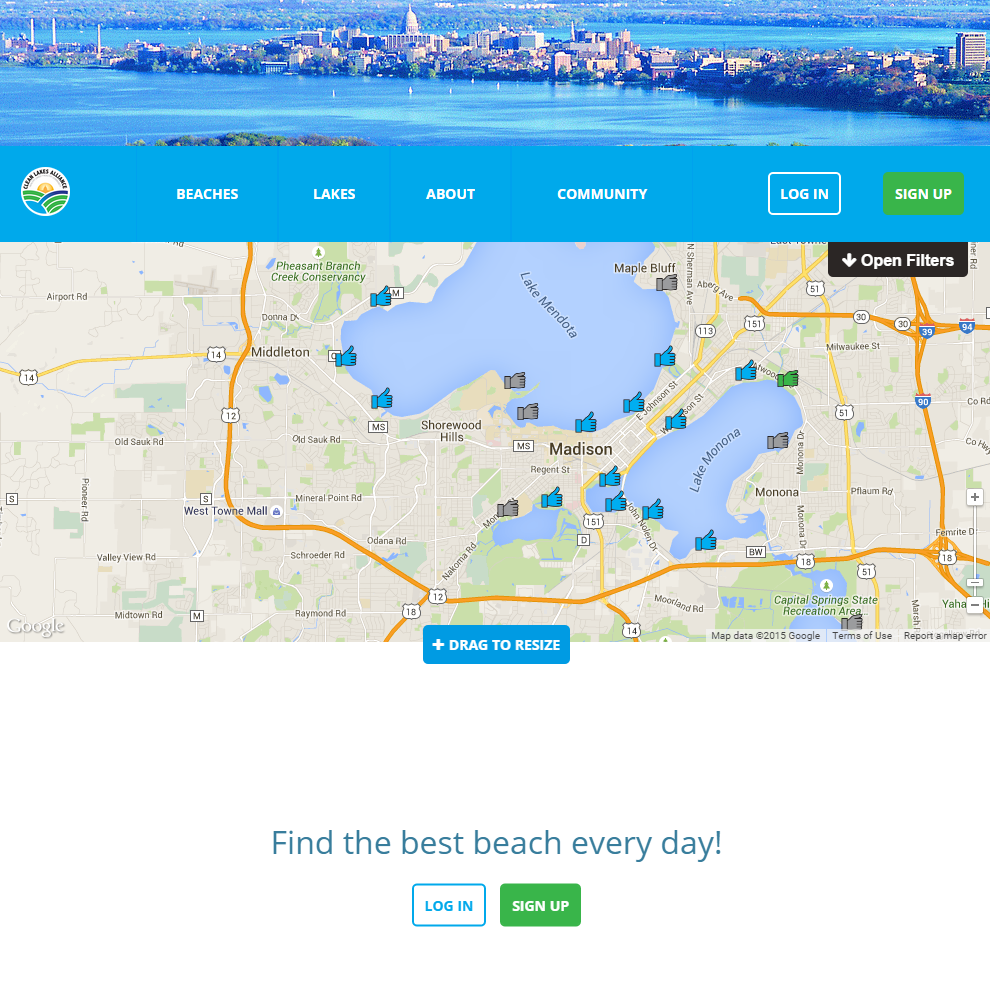
In LakeForecast, beach closure information appears on the front-page map. Open beaches with good water quality get a blue thumbs-up; open beaches with poor water quality get a green hand; closed beaches get a red thumbs-down. (Gray hands, for beaches with no data, will disappear as LakeForecast moves out of beta.)
For people who travel to get to a beach—which is almost everyone—this alone is valuable information. Before you set out, you can check the general conditions at your intended destination, even if you don’t know its name. If you decide to go elsewhere, you can look for alternatives based on both water quality and amenities like restrooms and drinking water.
But this is all in service of LakeForecast’s ultimate goal: to engage Madison-area residents in water quality by providing them with the most complete and up-to-date picture of the state of their lakes that they’ve ever had.
That’s an undertaking that needs a lot of data. Much of that data will be provided by CLA volunteers: citizen water quality monitors who use another side of LakeForecast.
Citizen monitors take measurements and make observations about water quality at designated locations. In 2014, the program’s second year, it included 42 volunteers at 46 locations; a similar number are participating this year. And as in 2014, 2015’s citizen monitors will log their observations in LakeForecast.
Citizen monitors have their own logins for LakeForecast, which gives them access to pages where they can review their previous observations and enter new ones.
Some of the data that they collect is quantitative, including water temperature, air temperature, and turbidity, which is a measure of the water’s clarity. Monitors attend group training to ensure that measurement techniques for this data are as consistent as possible.
But citizen monitors also collect qualitative information about factors like the amount of algae and number of ducks and geese present at the site. Which raises questions like: how do you standardize the difference between some algae and lots of algae for almost fifty people?
LakeForecast uses photos. For each qualitative observation that citizen monitors log, each choice has an associated picture.
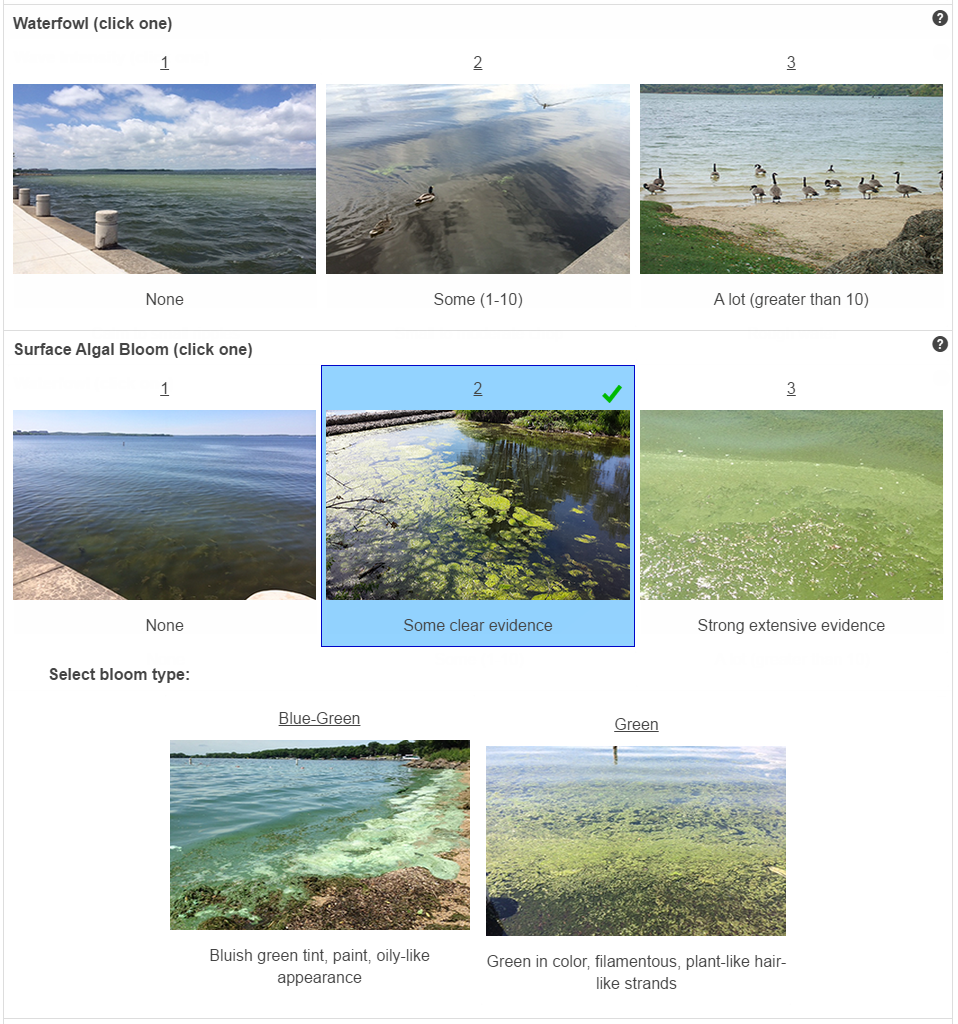
Photos make sure that everyone is starting on the same page, even if different monitors draw the line between options in slightly different places.
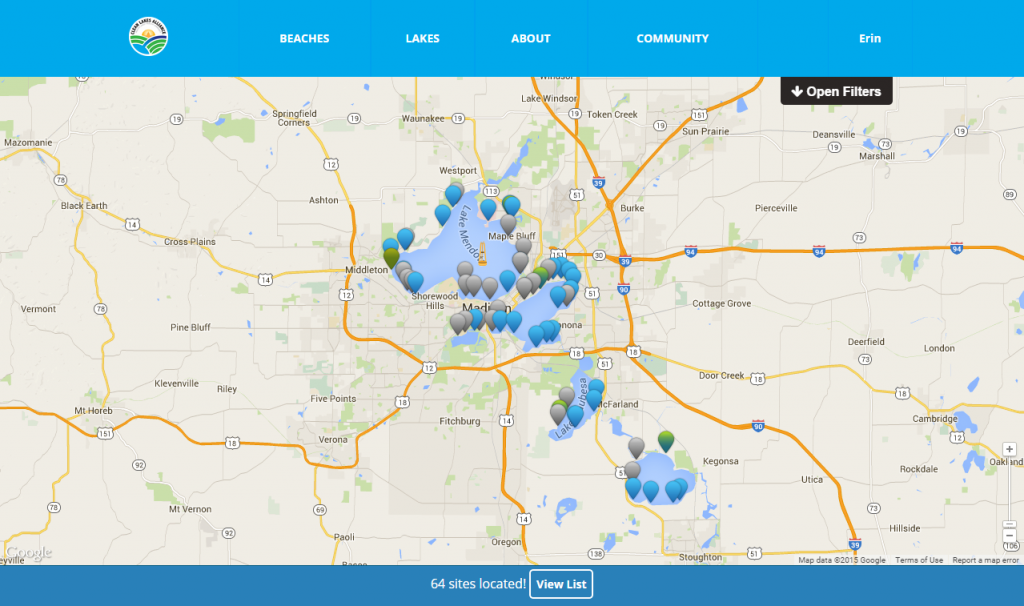
Community members can use LakeForecast to see a map or list of the sites that citizen monitors sample, using the Lakes menu option.
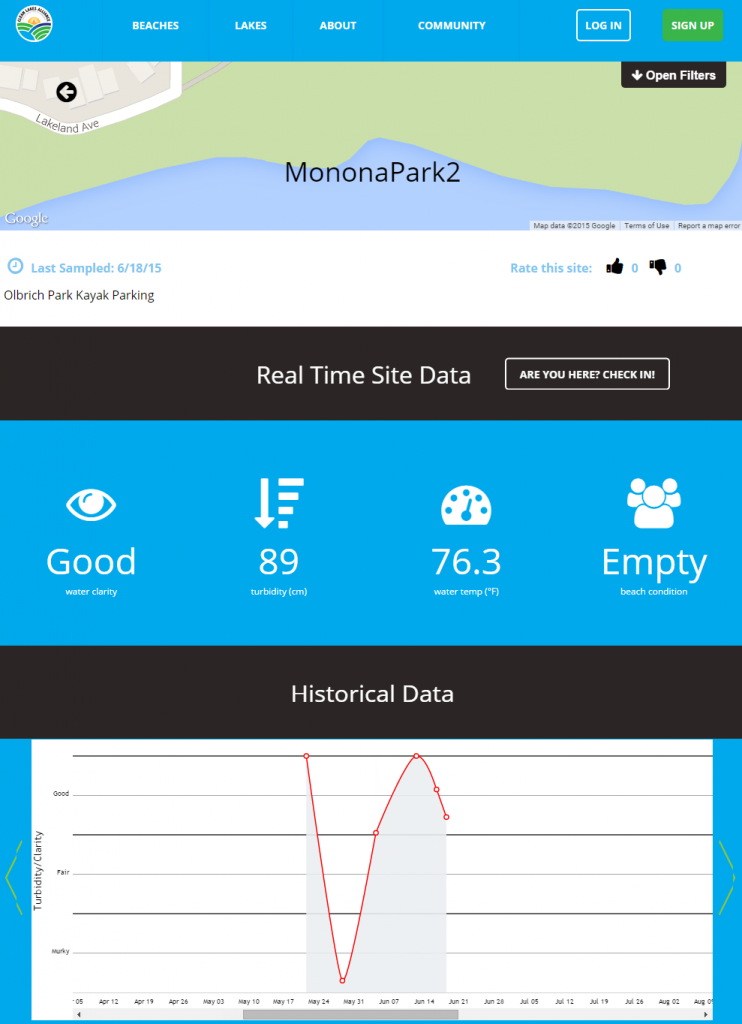
Clicking on a site displays some of its collected data.
LakeForecast also displays data from the Mendota buoy. The buoy, which sits just under a mile off of Picnic Point, provides information on conditions in the middle of the lake.
The importance of monitoring lake conditions as frequently as possible was emphasized by CLA’s 2014 E. coli bacteria testing of the beach at James Madison Park, a popular park near downtown.
Public Health Madison and Dane County (PHMDC) tests water quality at sixteen local beaches, including James Madison. If E. coli or blue-green algae levels exceed certain limits, the beach will be closed. But PHMDC only has the manpower to test once per week most of the time; only closed beaches are tested daily.
E. coli and blue-green algae are two prominent results of poor water quality that Madison beachgoers are likely to encounter. Both can make you sick.
E. coli is probably the better known of the two, or at least the more familiar name. It’s a bacteria, and most strains are harmless; it’s normal to have them in your gut. Some strains, though, can cause illness, primarily gastrointestinal distress. Their presence also increases the risk of dangerous pathogens in the water.
In the lakes, E. coli is generally present because sewage or animal waste has been washed into the water. Between the nearby manure-fertilized farmland, the resident dairy cows, and the large Canada goose population that perpetually stalks Madison’s shores, some level of E. coli in the water is inevitable, especially after rain and near stormwater inlets.
The algae is also inevitable. And unlike E. coli, you can see it.
Green algae is one thing. It’s a plant, and it has a slimy gross feeling to the touch, but it serves an important purpose: it’s part of the food chain. Small organisms eat it, and these are in turn eaten by larger fish, which are eaten by even larger predators, including humans. There should be green algae in the lakes.
But the problem is that the lakes also contain blue-green algae. Blue-green algae, despite the name, isn’t really algae: it’s a cyanobacteria, and it’s not significant in the food chain. Instead, its living blooms can block light that other aquatic organisms need, and the breakdown of dead blooms can deplete the water’s oxygen.
Dead blue-green algae blooms also pose another, more immediate hazard for lake users. When blue-green algae cells break down, they can release toxins. Some are fairly mild, and will give you a rash or cause vomiting; others can cause organ damage, seizures, or cardiac arrest.
Not all blue-green algae blooms produce toxins when they die, and not all toxins will cause severe illness. Most adults will be deterred from ingesting toxins from a dead bloom because the water is likely to be discolored or smell bad when a dead bloom is present. But pets and young children, in particular, may be less discriminating and ingest the water anyway, putting themselves at risk.
And like E. coli, blue-green algae is common. Agricultural runoff that contains commercial fertilizer pours nutrients like nitrogen and phosphorus into the lakes, encouraging blue-green algae growth. (Ordinary plant life also thrives on the fertilizer diet, as anyone who’s seen the county’s aquatic weed harvesters in action knows).
So last year, CLA collected samples from the James Madison beach every Monday through Friday from Memorial Day to Labor Day.
The samples went to PHMDC for analysis. On four of CLA’s test days—days where, if CLA hadn’t taken a sample, no one would have—E. coli levels were above the cutoff, and the beach was closed. Near-daily sampling caught conditions that weekly sampling would have missed.
Starting this year, lifeguards at four Madison beaches will make observations similar to those made by citizen monitors. At six other popular beaches, CLA plans to test the water on Thursday. This will supplement PHMDC’s regular testing with information closer to the weekend, before people head down to the water.
"Lake Wingra 07-03-2011..." by Richard Hurd | CC By 2.0
Just looking at data, though, isn’t as engaging as contributing it: and remember, LakeForecast’s ultimate goal is engagement. So LakeForecast’s public debut brings a pilot expansion of the water quality monitoring project that will let community members get involved, without having to make the time commitment required of citizen monitors.
Community members can create a LakeForecast account and check in when they visit any beach or monitored site. During check-in, they can report their own observation of whether the water is Good, Fair, or Murky. The check-in page also provides buttons so that community members can automatically tweet or post on Facebook about their visit, with a link to the LakeForecast page for the site they just rated.
CLA included social media integration to further drive community engagement and promote the lakes’ recreational opportunities. The real-time information and commentary that platforms like Twitter and Facebook can provide is also very valuable.
Conditions in the lakes are fluid, pun completely intended; the near-shore conditions, including water clarity and hazards like E. coli and blue-green algae, can be very different in different places.
The wind, especially, can be a factor: upwind beaches can be very clear at the same time that downwind beaches are plagued with algae and washed-up weeds. But according to James Tye, CLA's executive director, people often don’t realize that conditions can be so different for different beaches on the same lake.
Hopefully, LakeForecast’s social media will help to bridge that awareness gap, and contribute to establishing community awareness of water quality as a quality-of-life issue.
“In Madison, we want to get to the point where, on a daily basis during the summer, our water quality is talked about by the weatherpersons on all three TV stations,” Tye said. “Just like they talk about traffic, pollen, fall color, and all those other things.”
Check out LakeForecast’s beta version now at lakeforecast.org!

 For Data Migration