One day, we got a call from one of our clients: they had a deadline to submit data to another organization, and they’d spent months struggling to meet the requirements. With the deadline imminent, they’d made no headway. Could we help?
We set up a meeting to discuss their issue with them. Little did we know that this experience was going to be a perfect illustration of how data tools make assumptions about the nature of the data you’re working with… and how those assumptions aren’t always accurate.
The root of our client’s problem was that they couldn’t make horizontally repeating data into vertically repeating data.
You see, the only way they could extract some of their repeated data—say, a list of procedure code/date pairs—was like this:
Account number, Code1, Date1, Code2, Date2,….CodeN, DateN.
That is, as a fixed number of horizontally repeating columns.
Unfortunately, the receiving organization wanted the data to repeat vertically, like this:
Account number, Code1, Date1
Account number, Code2, Date2
.
.
.
Account number, CodeN, DateN
Three sections of the client’s file extract had repeated data: nearly 100 columns total. Our client only had Microsoft Access and Excel to work with, and, like other smallish community hospitals, they had limited IT support and little or no data wrangling experience.
By the time they called us, they were extremely frustrated. They could see exactly what they needed to do just by looking at the data. But the tools at their disposal didn’t seem to be helping them.
They were right. With our client’s tools, even an experienced person—which our client didn’t have—would have to create large hand-written union queries to get the job done.
Aren’t computers supposed to help with problems like this? Well, yes, at least in theory. But in practice, it doesn’t always work out that way.
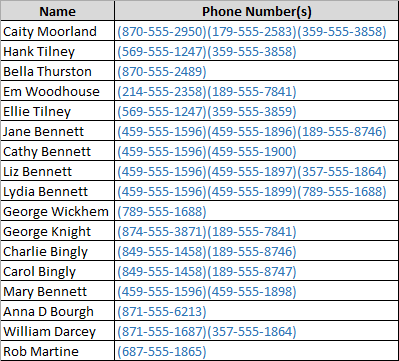
Take, for example, a very simple list of names and phone numbers. If you wrote such a list on a piece of paper, it might look something like this:

It makes perfect sense to us that each row of our phone number data can be a different length, because we see all the phone numbers as a single entity.
Now let’s say we want to analyze our phone numbers. If we put them into a single table like a spreadsheet, we need to put each phone number in a separate column, like this:
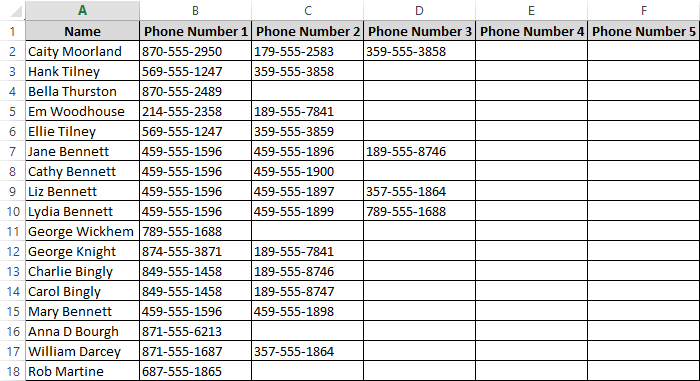
This approach requires us to choose an arbitrary maximum number of phone numbers. Because all phone numbers aren’t in the same column, we might also have to analyze each column separately and then combine the results of the analyses to get a total result.
An alternate approach that database applications often use is to make a vertically repeating table, like this:
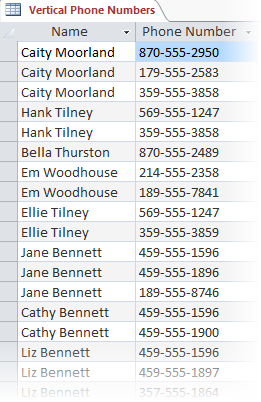
The vertical approach lets us analyze all the phone numbers at once, but duplicates non-repeating items like names. We can get around this by creating additional tables, but if we want to access related data from multiple tables, each table needs to have a common “key” so they can be joined together.
Both the horizontal and vertical approaches require us to force repeating data into “rectangular” containers. In other words, we have to store our data in rows and columns, with exactly one item per cell, and the number of columns in each row has to be the same. We’ve all been conditioned to think that this is just how it’s done and how it has to be.
The vast majority of data tools use the rectangular paradigm. Transforming repeating data from horizontal to vertical and vice versa, like our client needed to do, generally requires a database of some kind and a working knowledge of SQL.
But why should we force repeating data into rectangular structures, if that’s not congruent with how we, as humans, think about the nature of repeating data?
Today, I want to discuss an alternative approach to working with horizontally repeating data: a structure called repetitions. Repetitions are variable-length lists of items (like that list of phone numbers) that can exist as a single column.
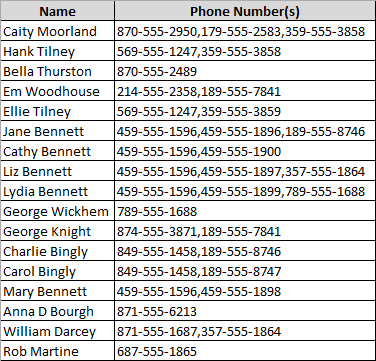
To see what this looks like, put the phone number data in a spreadsheet again. But this time, put all the phone numbers for each person in a single cell separated by commas:
Now pretend that the cells in the spreadsheet could contain repetitions in the form of referenceable subcells. Perhaps A1(1) would refer to the first item in cell A1, A1(2) would be the second item, and so on.
Imagine that there’s some way to easily parse the phone number column into subcells using the comma as a delimiter, and that the program visually represents subcells by placing parentheses around each item, like this:
Notice that in this phone number repetition, each row can have a different number of ‘phone number’ items.
Finally, envision the spreadsheet accounting for the number of phone numbers in each cell when it performs column operations, like counting:
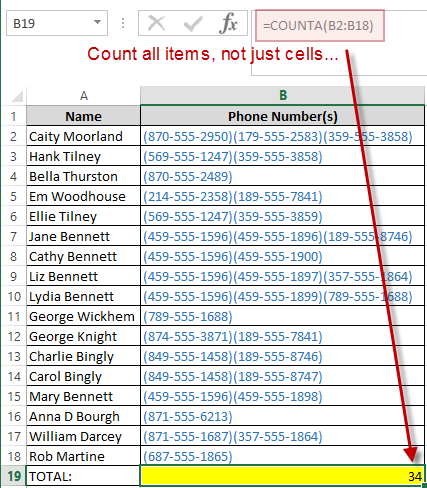
But, since spreadsheets don’t actually do this, I’m going to show you how it works with one of our own tools.
In the video below, I parse our now-familiar phone number data into a name and phone number column. Then, I create a repetition of phone numbers like I just described, and analyze the phone numbers to find and drill down to records containing the number that occurs most frequently:
As you can see, repetitions can quickly remove the confines of the rectangular data paradigm for horizontally repeated data.
When our client hospital called, we were able to solve 80% of their issue just by using repetitions, because it is so easy to manipulate an entire repetition all at once.
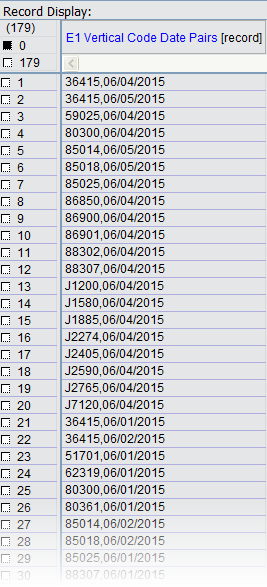
For example, our client’s data had 50 columns of code/date pairs, which could be parsed into two separate repetitions for further processing:

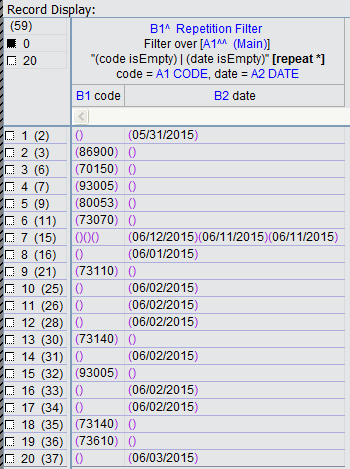
While I was meeting with our client, I created this repetition, and our client noticed—like you probably have—that there were empty pairs of parentheses in the code and date repetitions.
Since every code was supposed to have a matching date, I applied a repetition filter to keep only items where a code or date was missing. Then, just like I did in the video with the phone number data, I drilled down into these records:
There was pretty much a collective gasp from the client side of the room when I did this. When I asked them about it, they said they were shocked by how easy it was to see what was going on, compared to their previous struggles.
As they started investigating items without codes or dates in their source systems, I knew that our client was already getting value far beyond the intent of our meeting, and it was all because the repetition paradigm matched the inherent nature of their data.
Having repetitions made the horizontal-to-vertical conversion easy for our client. In our implementation of repetitions, you can easily “reverse” the repetition process by concatenating the items with a delimiter. Using a vertical delimiter like a carriage return instantly makes horizontal repetitions become vertical:
Our client’s excitement when they could finally see what was going on in their data without the structure getting in their way is the lasting image for me from this particular experience. I know I couldn’t have done the same thing for them if I had used Excel, Access, or any other database.
A variant of Maslow’s Hammer is particularly apt here: if the only data tools you have use tables, than all your problems are going to look rectangular. And some problems are—but not all.
To pick the most useful data tool, you can’t assume you have a rectangle: you need to understand the real shape of the problem, starting with the true nature of the data you’re working with.

 For Data Migration